(This is the 3rd post in a series that started here)
In my last post, we determined that the half marathon splits for Boston 2014 seem to skew more toward positive splits as finish times increase than the splits from other marathons. Why is that? Is it something about the Boston course, or something about Boston 2014 in particular?
Since the BAA doesn’t post splits for the years before 2013, and the 2013 data is skewed because of the bombing, we can’t easily determine the distribution for a typical Boston marathon. So we’ll have to try to get at the issue from another direction.
I have a theory. I suspect that the trendline for the 2014 Boston splits skewed somewhat more positive mostly because it was warm and the extra wave and slower field composition emphasized the impact of the temperature. The secondary reason was that people were extra enthusiastic to run and more determined to finish, no matter what, after the 2013 bombing.
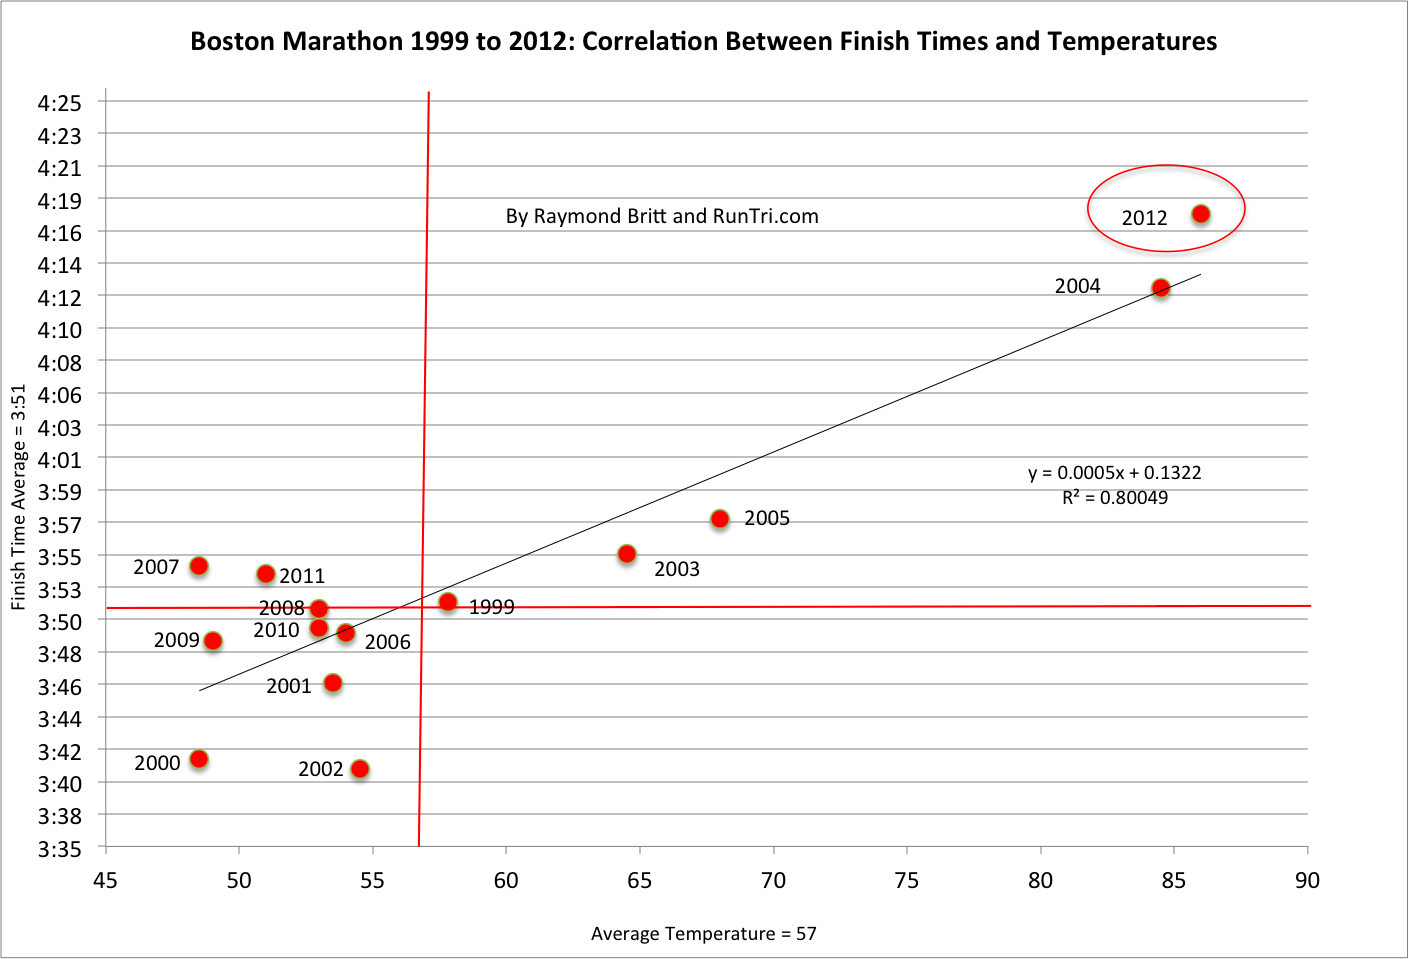
The average finish time for 2014 was 4:02:30, faster than the times for the exceptionally hot years of 2004 (4:13:02) and 2012 (4:18:27), but slower than every other year since 1999.
This year’s average temperature in the upper 50’s maps to a time of about 3:53-3:55, according to a chart from RunTri.com:
However, the addition of the fourth wave meant that 9000 runners started later, when it was warmer. Add in the fact that the fourth wave was made up of non-qualifiers, many of whom were runners who weren’t able to finish in 2013 (by definition mostly the slower runners in that field). That means that in 2014 more runners spent more time running in the warmer part of the day. The result was likely to be even slower finishing times, and quite possible splits more positive than they would otherwise be.
Then you throw in the exceptional level of interest by runners and the intense media buildup to Patriots’ Day created by the 2013 bombing, add the extra waiting in Hopkinton because of the new security procedures, and you have a recipe for more runners than ever going out too fast in the first half and hanging on just to finish. (I know I did.)
Any addition determination to finish after 2013 is just the icing on the cake (well, on a hot day, the icing would melt, but you get the idea). The BAA reported that 98.4% of the runners who started in 2014 made it to the finish. That’s great, but not historically great. For example, in 2011, the finishing rate was 98.2%.
Nevertheless, 98.4% is very good for a marathon on a warm day. This chart from a PLOS One study:
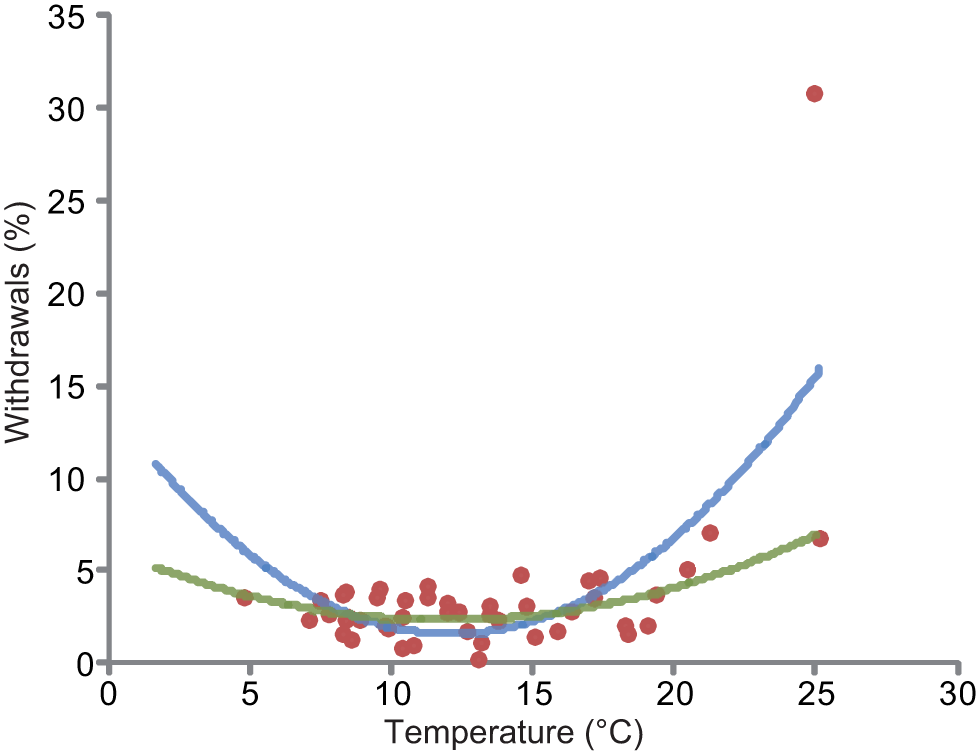
shows a typical dropout rate of about 3% at 59 degrees (15 degrees Celsius).
Don’t let the presentation fool you. Finish rates of 98.4% and 97% may seem similar, while a dropout rates of 1.6% looks to be much less than a rate of 3%. But both sets of numbers describe the exact same data.
I can’t prove that my explanation for the steeper slope of the trendline describing the ratio between splits is true (maybe I need to take more math classes?), but I’m happy with it.
For an analysis of the split data broken down by age, see my next post.
Pingback: Splits from Other Marathons vs. Boston 2014 | Y42K?
Pingback: Leituras de 5a Feira | Blog Recorrido